| Version 5 (modified by , 16 years ago) ( diff ) |
|---|
Functional Specifications https://trac.sahanapy.org/wiki/BluePrintDecisionMakingFunctional
The Delphi Decision Maker - Version 1.0
Technical Specifications
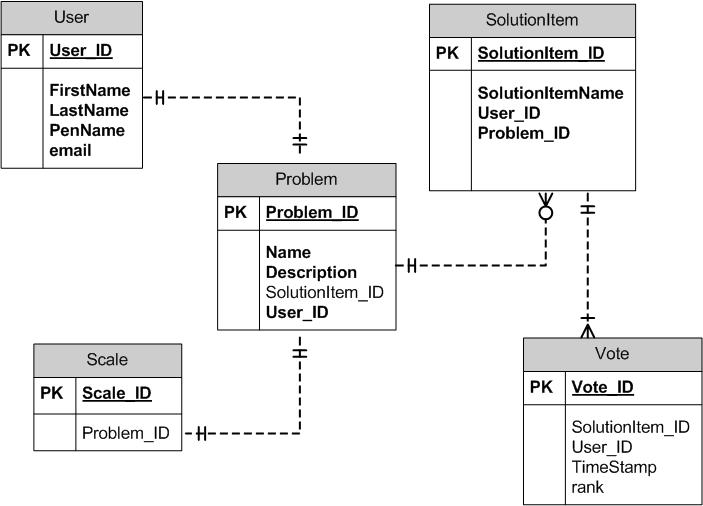
Version 1.0 ER Diagram for the Database Design =
Matrix Calculations for Thurstone's Law of Comparative Judgment
there are three calculations that occur - normally in a MxM matrix where all of the options are across the first row and column. when explaining it to someone, you read where item in the row item is selected against the item in a column that it's being compared to. now for every paired comparison, let's use (3, 2) - a frequency count is maintained. so, for every user, there will be a point where they select either (3) or (2) when the pairs are presented together. here, we'll keep it simple and say we have 10 users where 6 prefer option 3 over option 2.
<insert frequency matrix>
step 1: get frequency count of votes for each item pair so, this reads, item (3) is selected over item (2) 60% of the time. although it's good for the individual user to see how they voted as an individual, they key issue of this system is that we're getting a group calculation (which answers your next question). it's from this group calculation that a scale is made and hence, everyone can see. this way, they know what the 'group' opinion on the problem is. this is supposed to help them argue their idea of what's best if they see that the group is not voting the way they would overall.
step 2: change totals to percentages so, the first step is to keep a running total, a frequency count, of each paired pair's running total. next step is simple, the numbers are changed into a percentage (will be very different numbers obviously though when we have 200 - 2000 people using the system, but i'm going to keep it simple here to explain the process. so, the percentage matrix would be at this point: <insert percentage matrix> step 3: find equivalence number in the unit normal table so, from the code i gave you (because i don't have the book with the table by me (sorry)) you would match each number in each cell with the equivalent number in the unit normal table. so, it would look up 60% (and actually the table is the same sort of matrix as we have above (by chance)) and you'd go til you found 6 at the top, then 0 from the other part, but the code probably explains that better to you. i will try to find a UNT online and send. it's really a mapping problem i think. anyway, you change the numbers from the percentage to the equivalent number of that percentage into a UNT value, let's say - they end up being (and must be carried out to the 4th decimal place too: <insert final unit normal table matrix>
now the columns are totaled (each column represents an item option) and then these summed numbers are the ranked once put into an ascending order - but i don't think you do that - i think this is where the scale comes in. each number (item option) is represented on the scale and that shows the user where the group stands on the overall list. and vwa lah, that's the thurstone scale of comparative judgement! kewl, huh?
since there is supposed to be a very large number of users, there's no need to maintain every person's vote change in the frequency matrix. the idea is that, if they change their vote, you just add the vote on top of the existing frequency count. the theory is, that the large numbers of voters and voting will make a particular item surface to the top - so, no need to subtract one from an item if a user changes their mind, you simply add the new vote on top of the existing total votes (frequency matrix). And, about user story #4, Every user should be able to see the votes of other users? How should the user interface look like?
they look at the scale where the thurstone's final caculation is represented. a single group vote. this is the beauty behind the system, individuals all input and give there voice on a problem, but there is one running group vote that drives everything else (arguments in the forum to persuade others, then revoting if an individual changes their mind).
now remember that uncertainty is part of the other two scales - one to show the best case if all registered voters who haven't voted yet, voted in favor of an option.
difference = total voters - those who voted on that item
best case = (those who voted on an item + difference)/total voters (scale 2)
worst case = (those who voted on an item)/total voters (scale 3)
the difference between these and the regular calculation (scale 1) is that in scale 1 only the active voters are considered so the total voters is simply the total voters who actively voted on something (not everyone who could) because remember, they don't have to vote on every item, only those items (subgroup) they select.
Attachments (1)
- DDM-V1.jpg (39.4 KB ) - added by 16 years ago.
Download all attachments as: .zip


